
Performance turning process identifies the bottlenecks and eliminate it to get a better acceptable ETL load time. Turning starts with the identification of bottlenecks in source, target, mapping and further to session turning. It might need further turning on the system resources on which the Informatica PowerCenter Services are running.
This performance turning article series is split into multiple articles, which goes over specific areas of performance turning. In this article we will discuss about the session anatomy and more about bottlenecks.
Performance Turning and Bottlenecks Overview
Performance Turning Tutorial Series
Part I : Performance Turning Introduction.
Part II : Identify Performance Bottlenecks.
Part III : Remove Performance Bottlenecks.
Part IV : Performance Enhancements.
Part I : Performance Turning Introduction.
Part II : Identify Performance Bottlenecks.
Part III : Remove Performance Bottlenecks.
Part IV : Performance Enhancements.
Determining the best way to improve performance can be complex. An iterative method of identifying one bottleneck at a time and eliminate it, then identify and eliminate the next bottleneck until an acceptable throughput is achieved is more effective.
The first step in performance tuning is to identify performance bottlenecks. Performance bottlenecks can occur in the source and target, the mapping, the session, and the system. Before we understand different bottlenecks, lets see the components of Informatica PowerCenter session and how a bottleneck arises.
Informatica PowerCenter Session Anatomy
When a PowerCenter session is triggered, integration service start Data Transformation Manager (DTM), which is responsible to start reader thread, transformation thread and writer thread.
Reader thread is responsible to read data from the sources. Transformation threads process data according to the transformation logic in the mapping and writer thread connects to the target and loads the data. Any data processing delay in these threads leads to a performance issue.
Reader thread is responsible to read data from the sources. Transformation threads process data according to the transformation logic in the mapping and writer thread connects to the target and loads the data. Any data processing delay in these threads leads to a performance issue.
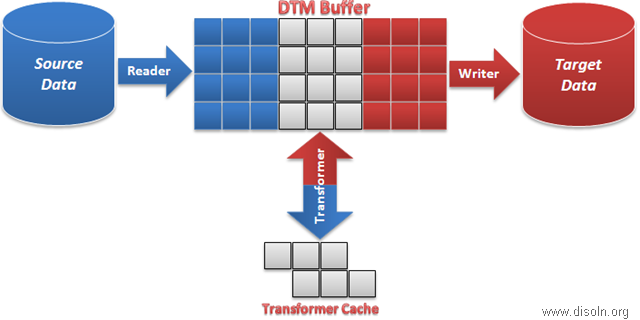
Above shown is the pictorial representation of a session. Reader thread reads data from the source and data transformation is done by transformation thread. Finally loaded into the target by the writer thread.
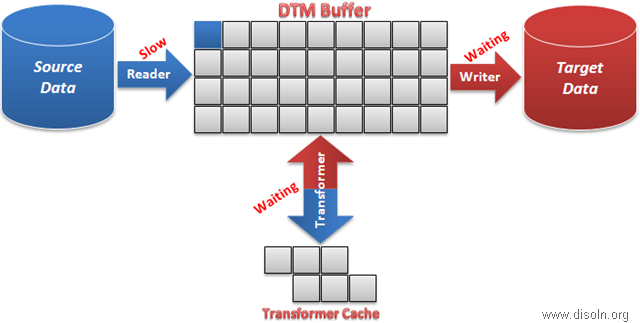
Source Bottlenecks
Performance bottlenecks can occur when the Integration Service reads from a source database. Slowness in reading data from the source leads to delay in filling enough data into DTM buffer. So the transformation and writer threads wait for data. This delay causes the entire session to run slower.
Inefficient query or small database network packet sizes can cause source bottlenecks.
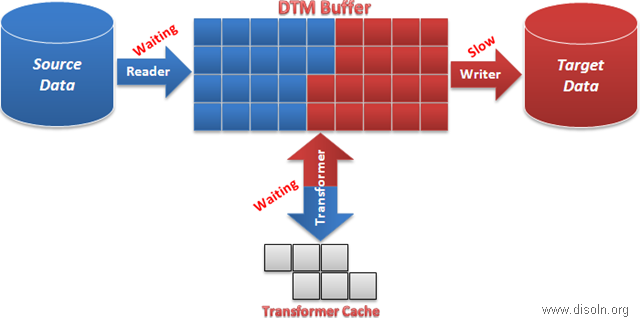
Target Bottlenecks
When target bottleneck occurs, writer thread will not be able to free up space for reader and transformer threads, until the data is written to the target. So the the reader and transformer threads to wait for free blocks. This causes the entire session to run slower.
Small database checkpoint intervals, small database network packet sizes, or problems during heavy loading operations can cause target bottlenecks.
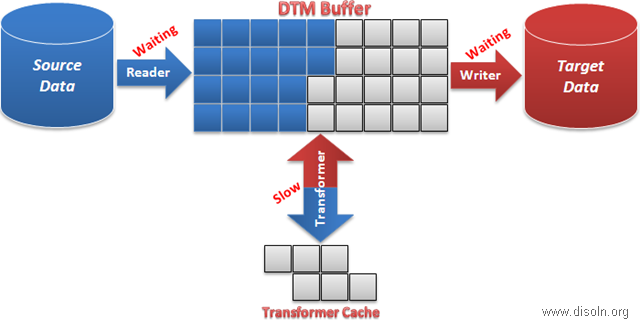
Mapping Bottlenecks
A complex mapping logic or a not well written mapping logic can lead to mapping bottleneck. With mapping bottleneck, transformation thread runs slower causing the reader thread to wait for free blocks and writer thread to wait blocks filled up for writing to target.
Session Bottlenecks
If you do not have a source, target, or mapping bottleneck, you may have a session bottleneck. Session bottleneck occurs normally when you have the session memory configuration is not turned correctly. This in turn leads to a bottleneck on the reader, transformation or writer thread. Small cache size, low buffer memory, and small commit intervals can cause session bottlenecks.
System Bottlenecks
After you tune the source, target, mapping, and session, consider tuning the system to prevent system bottlenecks. The Integration Service uses system resources to process transformations, run sessions, and read and write data. The Integration Service also uses system memory to create cache files for transformations, such as Aggregator, Joiner, Lookup, Sorter, XML, and Rank.
What is Next in the Series
In the next article in this series, we will cover how to identify different bottlenecks using session thread statics and session performance counters. Hope you enjoyed this article, please leave us a comment or feedback if you have any, we are happy to hear from you.